Example of Cost Benefit Analysis

Contents
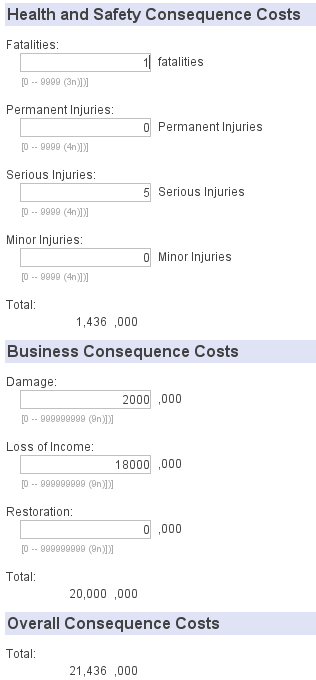
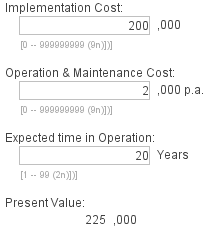
A risk is assessed as having a likelihood of occurring 1 time in every 10,000 years (0.0001 times per year) and a consequence of 1 fatality, 5 serious injuries, 1 month of production loss at $600,000 per day and $2 million worth of property damage. It is proposed to install a SIL 2 rated safety instrumented function which will reduce the likelihood of the risk from 1 in 10,000 years to 1 in 1,000,000 years (0.000001 per year). The cost of implementing the safety instrumented function is estimated to be $200,000 up front capital with $2,000 per annum of ongoing maintenance for the life of the plant which is estimated to be 20 years. The discount rate for the organisation is 8%.
Consequence of Fatalities = 1 x $1,336,000 = $1,336,000
Consequence of Injuries = 5 x $20,000 = $100,000
Consequence of Property Damage = $2,000,000
Consequence of Lost Production = 30 x $600,000 = 18,000,000
Total Consequence Cost = $2,000,000 + $18,000,000 + $1,336,000 + $100,000 = $21,436,000.
Current Risk Cost = Current Likelihood x Total Consequence Cost = 0.0001 x $21,436,000 = $2,143/year.
Proposed Risk Cost = Proposed Likelihood x Total Consequence Cost = 0.000001 x $21,436,000 = $21.43/year.
Benefit = (Current Risk Cost – Proposed Risk Cost) x Plant Life = ($2,143 - $21.43) x 20 = $42,431
Present Value of Cost = $224,924
Disproportion Factor = Present Value of Cost ÷ Benefit = $224,924 ÷ $42,431 = 5.3
Acceptable Disproportion Factor = 0.3648 x LN(R) + 3.2793 = 0.3648 x LN($2,143) + 3.2793 = 6.1
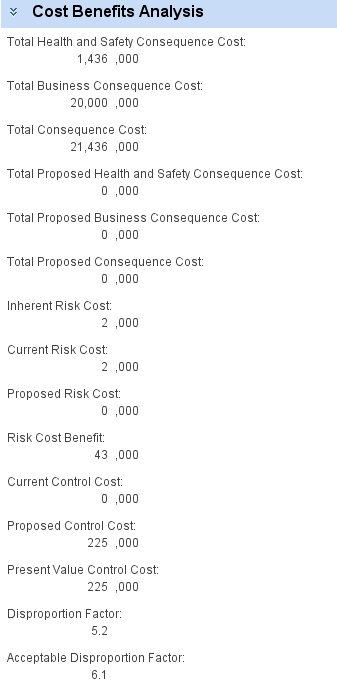
If Acceptable Disproportion Factor > Disproportion Factor then the installation of the safety instrumented function will be justified. As 6.1 > 5.2, the installation of the measure is justified.